
Canada’s water infrastructure is growing
By Adam Freill
Construction InfrastructureKeeping pace with replacement needs a challenge as a significant portion of linear water infrastructure over 50 years old in 2020.
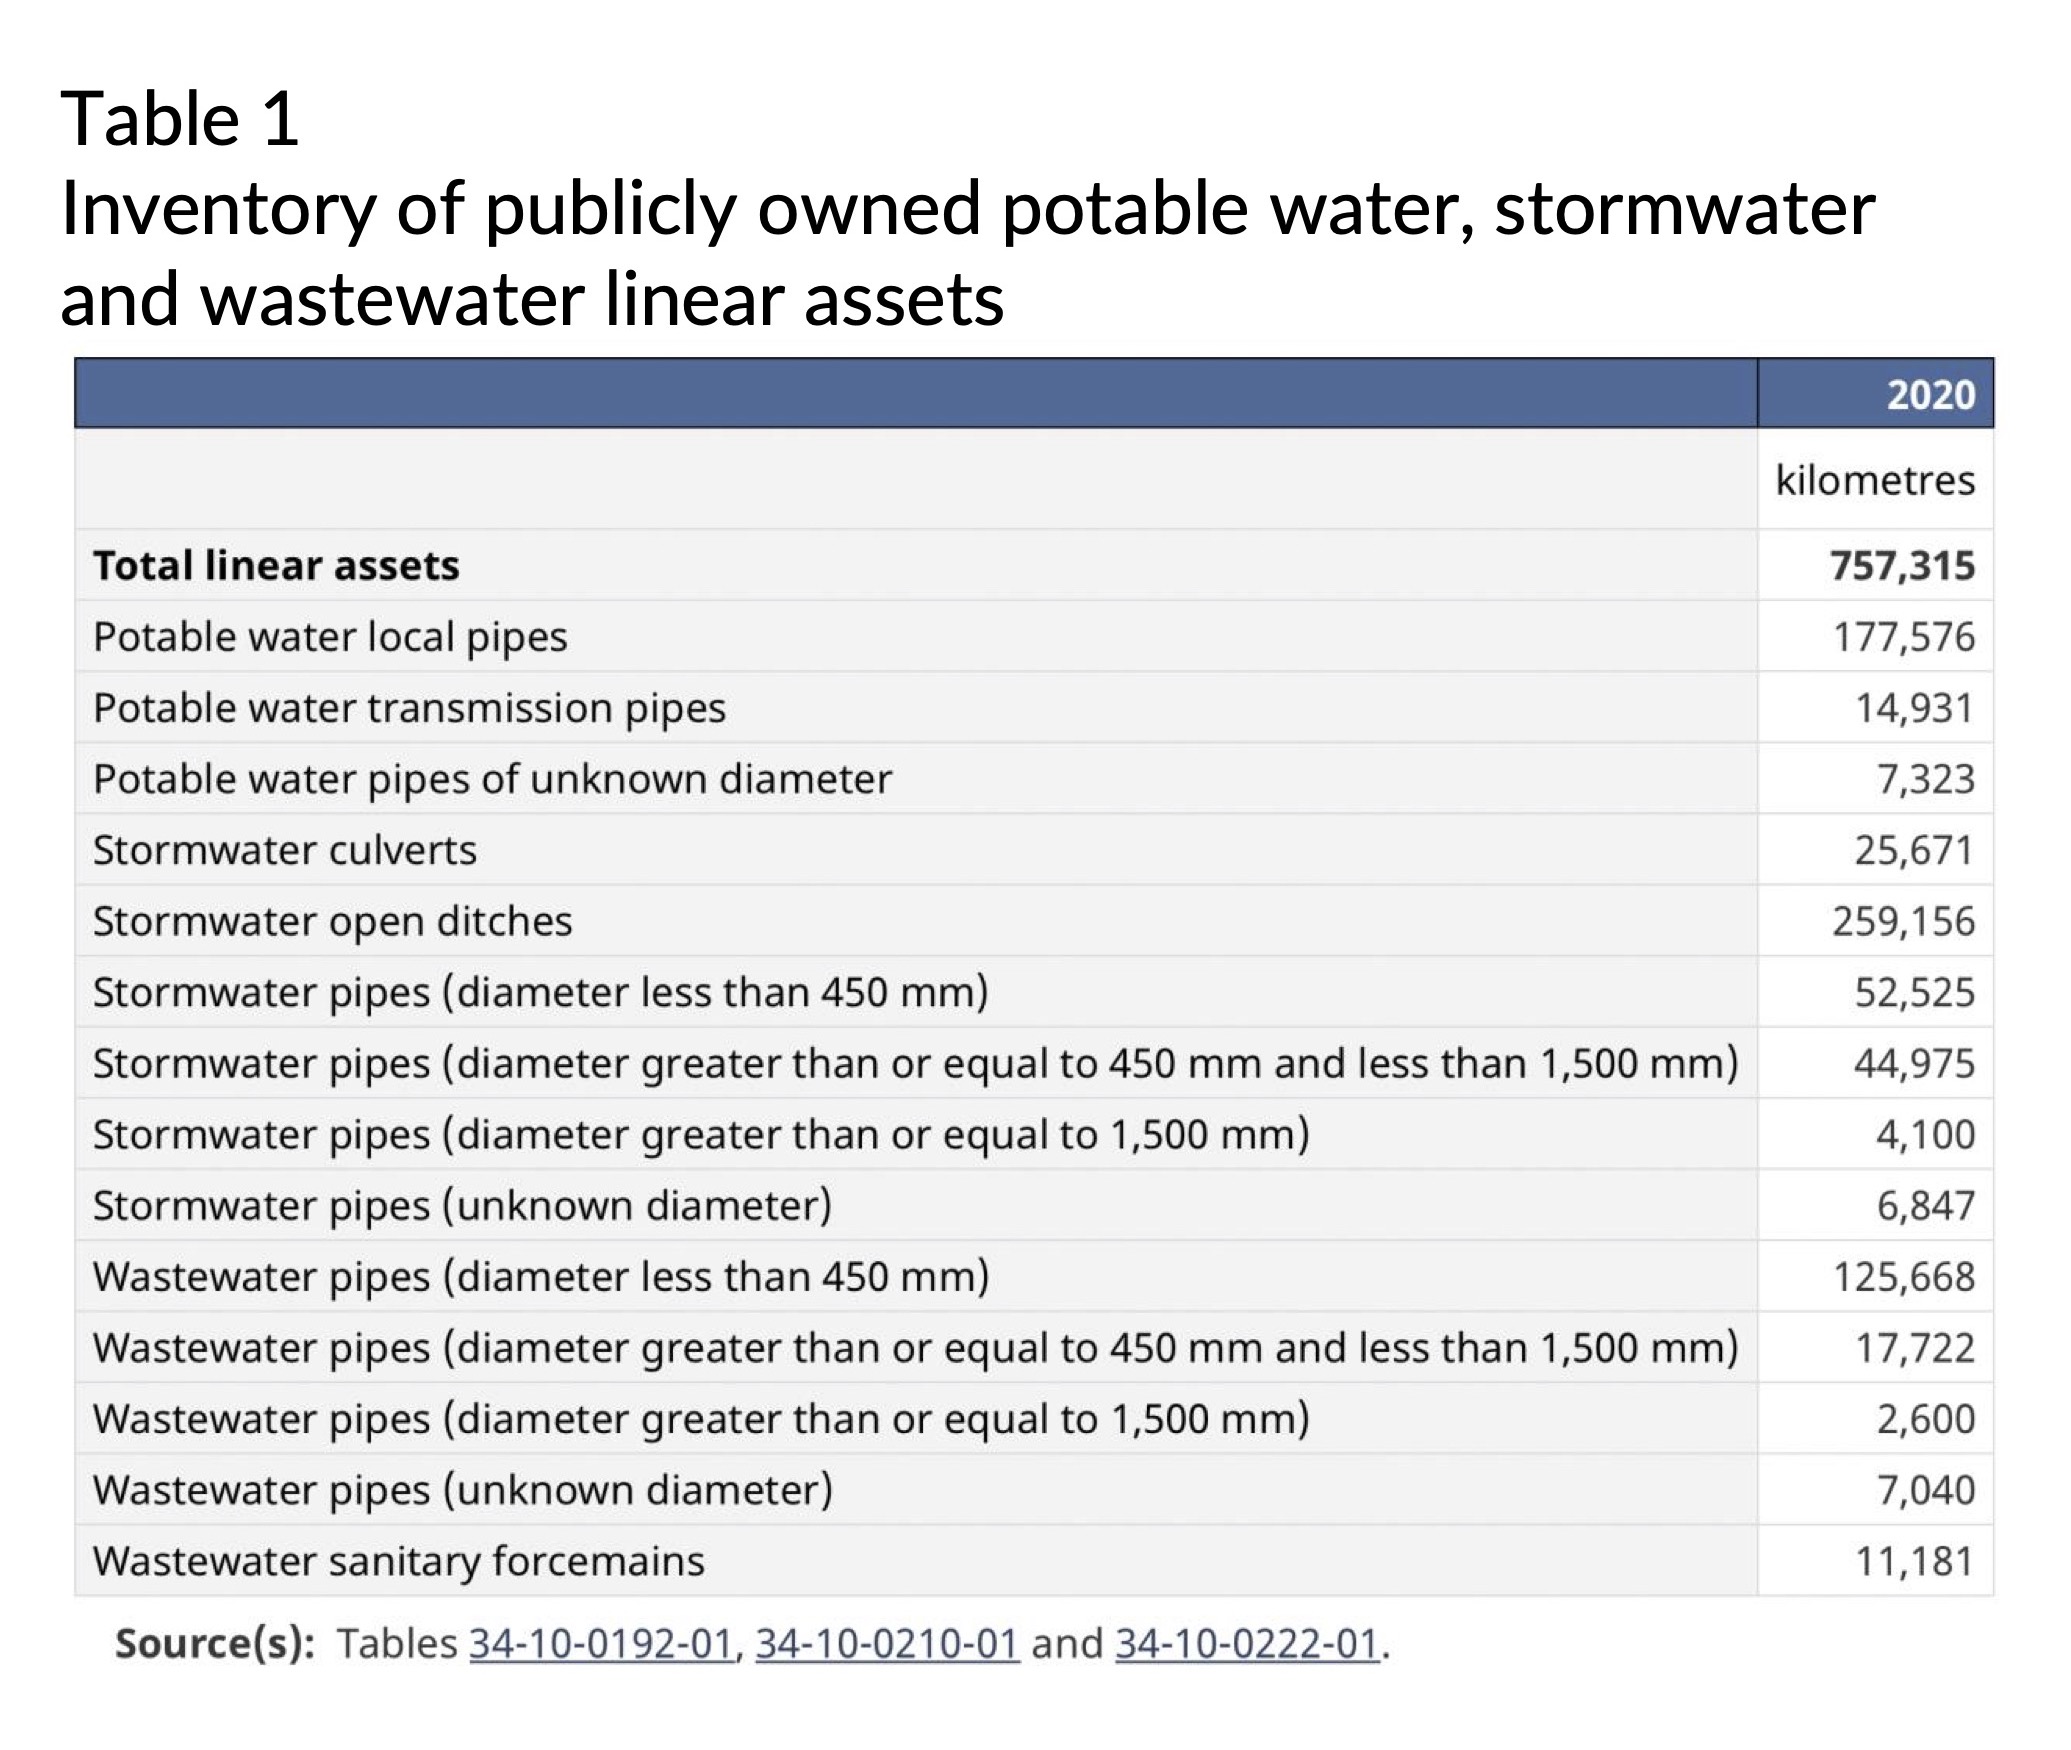
(Source: Statistics Canada, Tables 34-10-0192-01, 34-10-0210-01 and 34-10-0222-01.)
In 2020, Canada’s public water infrastructure included 4,126 wastewater treatment plants and lagoon systems, 3,342 water treatment facilities, 472,488 kilometres of underground pipes, and 284,827 kilometres of culverts and open ditches, as well as numerous pump stations, storage facilities, and other assets, reports Statistics Canada in its latest Core Public Infrastructure Survey.
The water infrastructure data from the survey, which was released earlier this month, measures the stock, condition and performance of assets owned by Canadian governments.
Municipalities are responsible for the vast majority of public water utilities in the country, accounting for more than 96 per cent of the organizations who reported water infrastructure in 2020. These assets require a significant amount of capital investments. According to the Annual Capital and Repair Expenditures Survey, 28 per cent of total capital spending on infrastructure by municipal, local and regional governments in 2020 was on water and sewer infrastructure.
The pace of construction of these systems continues to increase, with an average of 10,069 kilometres of underground pipe installed per year in 2019 and 2020, compared with around 6,844 kilometres per year from 2000 to 2018. While capital expenditures and the pace of construction of water infrastructure accelerated in recent years, these investments have not kept up with the deterioration of existing assets as the remaining useful life of water and sewage infrastructure assets declined from 2017 to 2021.
A significant portion of linear water infrastructure was over 50 years old in 2020. In fact, close to one in five kilometres of water, sewer and stormwater pipes (86,533 kilometres out of 472,488) was reaching the end of its useful life, having been built prior to 1970. The average expected useful life of new underground pipes installed in 2020 ranged from 50 to 73 years.
Stormwater management facilities such as ponds, wetlands and infiltration basins had the largest share (43 per cent) of total inventory built since 2010. Over one-quarter of the inventory of wastewater non-linear assets except lagoon systems (storage tanks, pump stations, lift stations and treatment plants), and of the inventory of drinking water pump stations and water treatment facilities were constructed in the period from 2010 to 2020.
Unlike most public infrastructure, water, sewer and stormwater pipes are hidden underground, making it challenging to assess conditions. In 2020, the condition of 12 per cent of the length of pipes was unknown, compared with 18 per cent in 2018. Almost three out of five kilometres were rated in good or very good condition in 2020, up from slightly more than half in 2018.
Statistic Canada says the improved data availability, in terms of the condition of most water infrastructure assets in 2020 compared with 2018, may be explained by the increase in the implementation of asset management practices. In 2020, there was an almost 10 per cent increase over 2018 in the share of organizations that owned water infrastructure and had an asset management plan. At least four out of five urban municipalities with 30,000 or more residents had an asset management plan for their water infrastructure in 2020, compared with just over two-thirds in 2018.